
Insights from testing should optimise SECE management
Maintenance strategies set out how performance standards for safety and environmentally critical elements (SECEs) will be met and when. For OPEX efficiencies and continuous improvement, equipment test result feedback and maintenance data should be exploited.
In our previous blog, SECEs are unnecessarily costly, we highlighted an industry-wide trend to over-assign these items, with solutions to address this challenge and set related performance standards. Here, we share our field findings on SECE maintenance and management.
Whether it’s an offshore asset or an onshore plant, we agree with the HSE’s statement that significant improvement in SECE maintenance systems is achievable without major capital expenditure. Better planning, improved training and a clear statement of performance standards in testing and maintenance routines are all suggested (Asset Integrity Programme, KP3, refers). We would add that learning from, and acting on, SECE performance data is particularly cost effective. But first it’s important to establish the foundations for sound management.
Start with a clear line of sight to hazards
Once identified, each SECE needs to be added to an operator’s computerised maintenance management system (CMMS) with both its associated performance standards and the task implementation procedures. That way, personnel have a clear line of sight from the assurance task through to every recognised asset hazard.
The assurance strategy should be led by an explicit plan on how the activities of SECE testing, inspection and corrective maintenance will be coordinated. For maximum safety and efficiency, the objective should be to do the right thing at the right time and – crucially – get this right first time.
Best practice is not to mix SECE assurance activities with maintenance tasks, keeping them separate as far as practicable. Where combining, it is vital to detail an item’s ‘as-found’ or pre-maintenance condition, and then follow the appropriate steps. The stem of a valve, for example, shouldn’t be lubricated before confirming that it would have operated to the requirements of the performance standard – such as operate on demand and closure time in its current condition. This is the critical step, particularly for SECEs that are dormant until required to operate on demand, to safeguard their reliability.
Covering the fundamentals of good management
A management system should clearly document how SECEs are identified and managed for consistency over time, especially following modifications to a plant or asset. Personnel must record maintenance activities, any repairs made to an item during maintenance and all corrective tasks if they are to understand ongoing SECE performance.
A management system should also provide details on staff competency and training, and cover a range of activities, including:
• setting acceptance criteria and sharing it via the work order
• managing task lists
• planning maintenance, including handling backlogs and defining acceptable levels
• managing change (MOC) of all parts
• accurate reporting and recording daily
• independent auditing
• managing and using SECE related data.
Targeting assurance and maintenance efficiencies using the correct data
Conventionally, maintenance programme timings are based on generic strategies or calculated equipment reliability rates which, taken from the Original Equipment Manufacturer (OEM), are generally conservative. The main problem is that both these approaches fail to consider operating and commercial changes over time. The consequences can be costly, from over-maintenance to an increasing backlog, with potentially greater asset risk and unplanned downtime.
Assurance and maintenance intervals can be safely optimised with strong data insights and learnings. How SECEs age and the matter of obsolescence, especially in safety control and instrumentation areas, is particularly key. The relatively straightforward task of reviewing solid maintenance history data – already gathered and paid for – can justify extended maintenance periods, with associated savings. Moreover, any bad actors identified can be tackled separately, an important further benefit.
A greater use of correct existing data can help to optimise equipment test intervals for safety systems. We have seen this across fire and gas detectors, fire dampers, emergency shutdown valves, pressure safety valves and safety instrumentation.
We’ve supported clients with work based on calculated inputs from the current test interval, the reliability or availability target, and the equipment failure rate. Equipment failure rate has a strong correlation to the plant site and process conditions. This means it is best calculated from the asset itself, rather than using generic representative data (that is, using industry reliability data sources). Additionally, it must be relevant to the critical function of the SECE. For example, for a pressure safety valve failing to open on demand in the ‘dangerous failure mode’. The failure rate of the pressure safety valve, in the context of SECE, should only consider the history of the valve when it didn’t lift during a test. Failures, such as valve leaks or lifting spuriously at low pressure typically cause production inefficiencies, but are not critical safety related and should be excluded.
A case in point
We recently completed a survey for a facility with over 1,000 pressure safety valves (PSVs), which had previously set intervals using a traditional qualitative-based RBI approach. From work completed on other assets, the client had decided to adopt an approach where the recertification interval was determined to meet a defined reliability target.
The process starts by grouping the PSVs by service fluids such as hydrocarbon gas, air, lubricating oil and so on. We then analysed the historic data to calculate a dangerous failure rate, looking at failures divided by a verified operating time. A target for reliability is set at 90% for a non-SECE valve and 95% for a SECE valve. The required interval is calculated as shown in the supporting diagram.
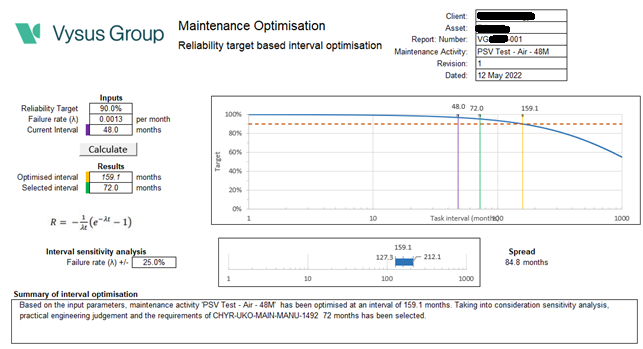
The output of this study not only ensured that the PSV groups would meet a known and defined reliability target, but also allowed for an increase in most cases of the inspection interval through a series of built-in checks and balance. For the largest groups, the average number of PSVs tested a year reduced from 118 to 84. As more history is gathered, further benefits will be gained.
Learning from SECE test results and an asset’s own operational data is cost effective and extremely valuable, maximising OPEX budgets while minimising disruption. Asking what testing is telling you should be an integral part of any SECE management strategy, driving continuous improvement.
Related Services