The recently published report from the Hydrogen Council highlights its projections for supply and demand trends globally as the hydrogen industry develops as a key component of the energy transition.
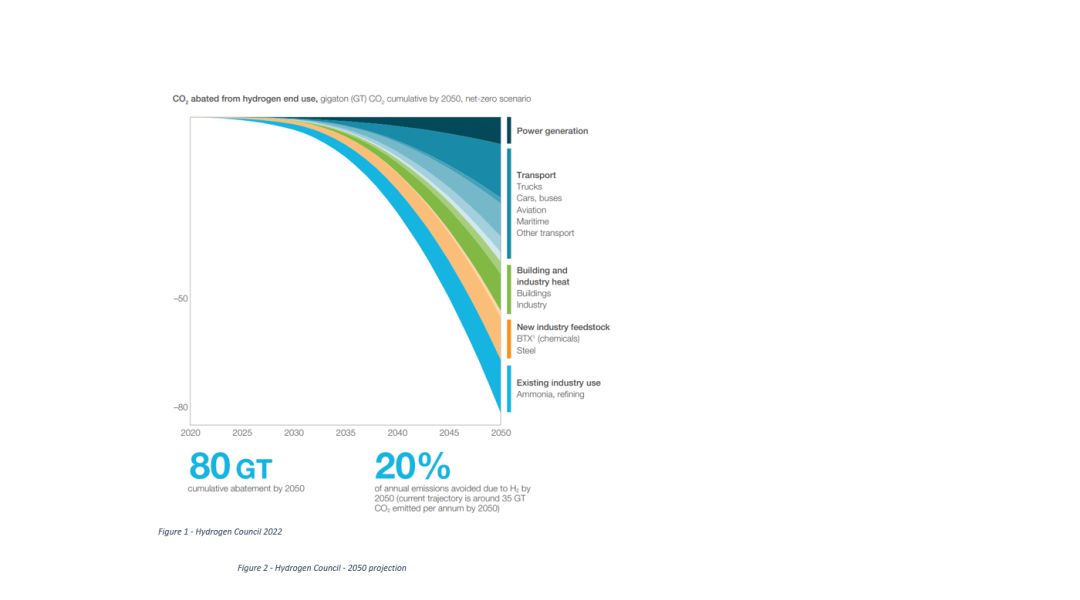
The forecast highlights the ability of clean hydrogen to provide 80 gigatons (GT) of cumulative abatement by 2050, equivalent to 20% of the emissions reduction required to meet the 2050 net-zero targets. The volumes of clean hydrogen required to deliver on those targets equates to an annual global demand for clean hydrogen of 660 MT (hydrogen and its derivatives).
What the forecast also shines a light on is the establishment of a supply chain spread globally from regions that can produce more economic rates to regions with high demands.
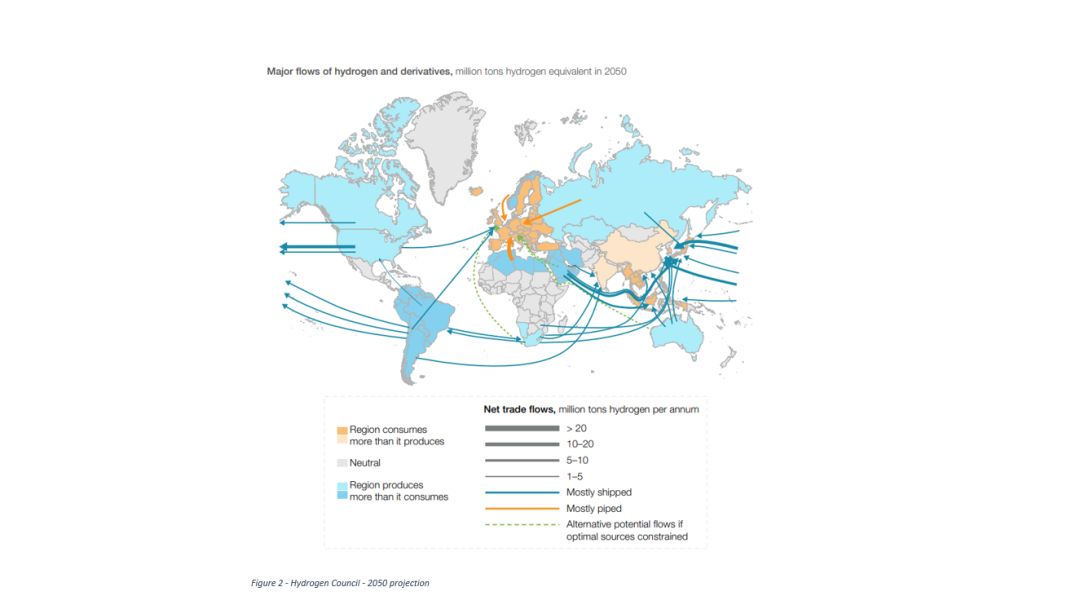
This raises a number of questions, not least, how this can be done in a safe manner. The project builds upon work already in progress, such as the European Hydrogen Backbone (EHB). The EHB maps out the development of a Europe-wide hydrogen distribution network via a mix of repurposed existing pipelines and new pipelines – and builds upon that with expected commercial shipping of the hydrogen and its derivatives globally. This calls for significant risk analysis to ensure the rush to implement does not overtake the ability to control and contain the risks in a practicable manner.
Another question the study raises is the question of clean hydrogen, and the current lack of a consistent standard for what is termed ‘clean hydrogen’. A demand figure of 660 MT globally needs a pause for thought. There are a number of organisations attempting to define a figure for clean hydrogen, but fundamentally, we need to know not if it is clean or not, but how much CO₂ is actually emitted producing that hydrogen.
We need to ensure that a full emissions profile for the production of the hydrogen is taken into account – time spent figuring out what scope 3 emissions to exclude would be better served defining them and setting out reduction plans.
Related Services